You are viewing the article As the Worlds Turn: Visualizing the Rotation of Planets at Tnhelearning.edu.vn you can quickly access the necessary information in the table of contents of the article below.
Misc
As the Worlds Turn: Visualizing the Rotation of Planets
As the Worlds Turn: Visualizing the Rotations of Planets
The rotation of planets have a dramatic effect on their potential habitability.
Dr. James O’Donoghue, a planetary scientist at the Japanese space agency who has the creative ability to visually communicate space concepts like the speed of light and the vastness of the solar system, recently animated a video showing cross sections of different planets spinning at their own pace on one giant globe.
Cosmic Moves: The Rotation of the Planets
Each planet in the solar system moves to its own rhythm. The giant gas planets (Jupiter, Saturn, Uranus, and Neptune) spin more rapidly on their axes than the inner planets. The sun itself rotates slowly, only once a month.
| Planet | Rotation Periods (relative to stars) |
| Mercury | 58d 16h |
| Venus | 243d 26m |
| Earth | 23h 56m |
| Mars | 24h 36m |
| Jupiter | 9h 55m |
| Saturn | 10h 33m |
| Uranus | 17h 14m |
| Neptune | 16h |
The planets all revolve around the sun in the same direction and in virtually the same plane. In addition, they all rotate in the same general direction, with the exceptions of Venus and Uranus.
In the following animation, their respective rotation speeds are compared directly:
The most visually striking result of planetary spin is on Jupiter, which has the fastest rotation in the solar system. Massive storms of frozen ammonia grains whip across the surface of the gas giant at speeds of 340 miles (550 km) per hour.
Interestingly, the patterns of each planet’s rotation can help in revealing whether they can support life or not.
Rotation and Habitability
As a fish in water is not aware it is wet, so it goes for humans and the atmosphere around us.
New research reveals that the rate at which a planet spins is an essential component for supporting life. Not only does rotation control the length of day and night, bit it influences atmospheric wind patterns and the formation of clouds.
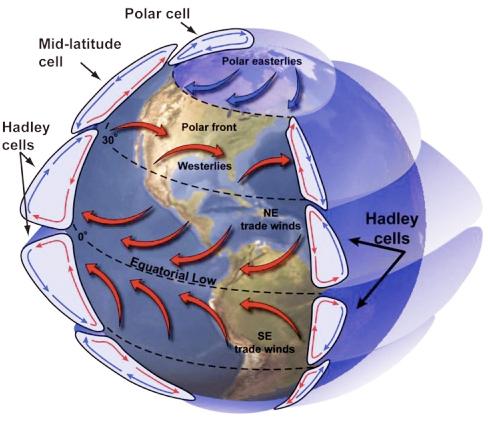
The radiation the Earth receives from the Sun concentrates at the equator. The Sun heats the air in this region until it rises up through the atmosphere and moves towards the poles of the planet where it cools. This cool air falls through the atmosphere and flows back towards the equator.
This process is known as a Hadley cell, and atmospheres can have multiple cells:

A planet with a quick rotation forms Hadley cells at low latitudes into different bands that encircle the planet. Clouds become prominent at tropical regions, which reflect a proportion of the light back into space.
For a planet in a tighter orbit around its star, the radiation received from the star is much more extreme. This decreases the temperature difference between the equator and the poles, ultimately weakening Hadley cells. The result is fewer clouds in tropical regions available to protect the planet from intense heat, making the planet uninhabitable.
Slow Rotators: More Habitable
If a planet rotates slower, then the Hadley cells can expand to encircle the entire world. This is because the difference in temperature between the day and night side of the planet creates larger atmospheric circulation.
Slow rotation makes days and nights longer, such that half of the planet bathes in light from the sun for an extended period of time. Simultaneously, the night side of the planet is able to cool down.
This difference in temperature is large enough to cause the warm air from the day side to flow to the night side. This movement of air allows more clouds to form around a planet’s equator, protecting the surface from harmful space radiation, encouraging the possibility for the right conditions for life to form.
The Hunt for Habitable Planets
Measuring the rotation of planets is difficult with a telescope, so another good proxy would be to measure the level of heat emitted from a planet.
An infrared telescope can measure the heat emitted from a planet’s clouds that formed over its equator. An unusually low temperature at the hottest location on the planet could indicate that the planet is potentially a habitable slow rotator.
Of course, even if a planet’s rotation speed is just right, many other conditions come into play. The rotation of planets is just another piece in the puzzle in identifying the next Earth.
Technology
Ranking U.S. States with the Best Internet Value
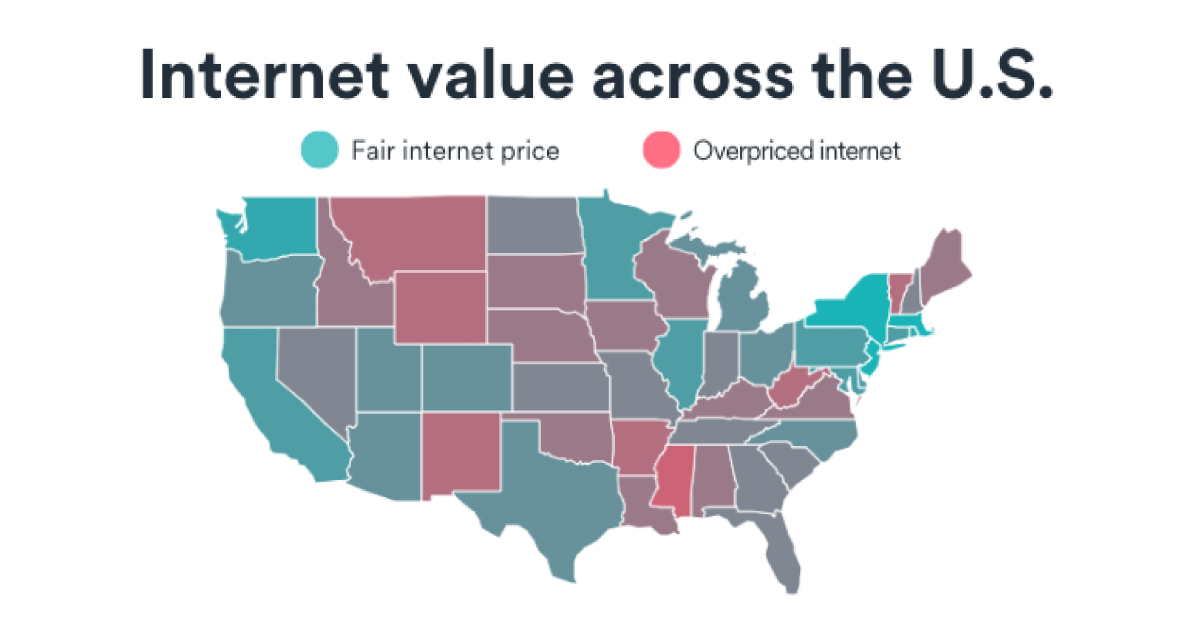
Which U.S. state has the best internet value? Browse this interactive map to see where states rank on the Internet Value Index.

Ranking U.S. States with the Best Internet Value
Internet access has increased over the years, but both internet speed and affordability can vary considerably around the world, and even within the U.S. itself.
This interactive data visualization by Surfshark examines which states have the best internet value on average, and which have the worst. It uses data compiled for the company’s 2022 Internet Value Index.
Calculating Value
How do you measure the “best” internet value?
Surfshark’s Internet Value Index scores U.S. states on both broadband and mobile internet, measuring the ratio of speed to affordability, with each factor defined as follows:
- Internet Speed: The average download speeds between Q3 of 2021 and Q2 of 2022.
- Internet Affordability: The average monthly price of a standard internet or data package divided by the average hourly net wage in each state.
Each state’s index value is calculated by dividing speed by affordability for both broadband and mobile internet, then normalizing over the maximum value of 1.0.
Which States Have the Best Internet Value?
Surfshark’s study revealed large disparities between rural and urban states, highlighting the country’s digital divide. Here’s their full list of 50 U.S. states and internet index rankings in 2022.
| State | Internet Value Rank | Broadband Value Rank | Mobile Value Rank | Region |
| New Jersey | 1 | 1 | 2 | Northeast |
| Massachusetts | 2 | 2 | 3 | Northeast |
| New York | 3 | 4 | 1 | Northeast |
| Rhode Island | 4 | 7 | 4 | Northeast |
| Washington | 5 | 9 | 6 | West |
| Maryland | 6 | 12 | 7 | South |
| Delaware | 7 | 10 | 8 | South |
| Connecticut | 8 | 5 | 10 | Northeast |
| Illinois | 9 | 11 | 9 | Midwest |
| California | 10 | 8 | 11 | West |
| Hawaii | 11 | 3 | 22 | West |
| Minnesota | 12 | 26 | 5 | Midwest |
| Pennsylvania | 13 | 14 | 12 | Northeast |
| Texas | 14 | 6 | 27 | South |
| Utah | 15 | 20 | 13 | West |
| Colorado | 16 | 25 | 14 | West |
| Ohio | 17 | 17 | 16 | Midwest |
| Arizona | 18 | 18 | 17 | West |
| Michigan | 19 | 27 | 15 | Midwest |
| North Carolina | 20 | 13 | 29 | South |
| Oregon | 21 | 22 | 19 | West |
| New Hampshire | 22 | 15 | 31 | Northeast |
| Indiana | 23 | 24 | 24 | Midwest |
| Georgia | 24 | 19 | 28 | South |
| South Carolina | 25 | 16 | 33 | South |
| Tennessee | 26 | 21 | 30 | South |
| North Dakota | 27 | 29 | 21 | Midwest |
| Nevada | 28 | 33 | 20 | West |
| Florida | 29 | 30 | 25 | South |
| Missouri | 30 | 35 | 23 | Midwest |
| Kansas | 31 | 28 | 26 | Midwest |
| Virginia | 32 | 44 | 18 | South |
| Wisconsin | 33 | 34 | 34 | Midwest |
| Kentucky | 34 | 31 | 36 | South |
| Nebraska | 35 | 23 | 47 | Midwest |
| South Dakota | 36 | 40 | 32 | Midwest |
| Alabama | 37 | 32 | 41 | South |
| Maine | 38 | 36 | 39 | Northeast |
| Oklahoma | 39 | 38 | 42 | South |
| Louisiana | 40 | 37 | 45 | South |
| Idaho | 41 | 42 | 37 | West |
| Iowa | 42 | 41 | 44 | Midwest |
| Alaska | 43 | 48 | 35 | West |
| New Mexico | 44 | 45 | 38 | West |
| Vermont | 45 | 43 | 43 | Northeast |
| West Virginia | 46 | 39 | 49 | South |
| Montana | 47 | 50 | 40 | West |
| Arkansas | 48 | 47 | 48 | South |
| Wyoming | 49 | 49 | 46 | West |
| Mississippi | 50 | 46 | 50 | South |
New Jersey, Massachusetts, and New York deliver the best value for internet services. Workers in all three states received fixed broadband speeds above 37 Mbps per hour of work at the average net state wage, and mobile speeds of 5 Mbps or more.
On the other end of the index, Mississippi, Wyoming, and Arkansas had some of the worst value services. Using the same ratio, workers got download speeds of 16 Mbps and below per hour of work for broadband, and mobile speeds of 2 Mbps or lower.
Regional disparity is quite clear, with five of the top 10 states being located in the Northeast. Eight of the bottom 10 states, meanwhile, were in the West and South.
Interestingly, the Midwest was the second best region for internet value, but still ranked below the country’s average score. This further highlights the disproportionate value earned by higher-income and heavily-populated states over others.
Internet For All?
Internet affordability (or lack thereof) can have economic consequences, particularly in the wake of the COVID-19 pandemic.
An IMF study details how high-speed internet has become critical for socioeconomic inclusion for work, education, and access to services.
As more workplaces and schools expect tasks to get done in a remote environment, it’s expected that affordable, high-quality internet will become even more critical going forward.
Popular
-
Money4 weeks ago
The Growing Auto Loan Problem Facing Young Americans
-
Datastream2 weeks ago
Ranked: The 25 Poorest Countries by GDP per Capita
-
Datastream4 weeks ago
Network Overload? Adding Up the Data Produced By Connected Cars
-
Datastream2 weeks ago
Ranked: The World’s 25 Richest Countries by GDP per Capita
-
Personal Finance4 weeks ago
Mapped: Minimum Wage Around the World
-
Environment2 weeks ago
Visualizing the Flow of Energy-Related CO2 Emissions in the U.S.
-
Gold4 weeks ago
Charted: 30 Years of Central Bank Gold Demand
-
Currency2 weeks ago
De-Dollarization: Countries Seeking Alternatives to the U.S. Dollar
Thank you for reading this post As the Worlds Turn: Visualizing the Rotation of Planets at Tnhelearning.edu.vn You can comment, see more related articles below and hope to help you with interesting information.
Related Search:

